...
... the reality is it was the least impressive expansion since WWII. Below I will explain why.
Before I move forward, let me address specifically any readers who still think the last expansion was "the Greatest Story Never Told." I am going to use facts to demonstrate why the latest expansion was terrible. If you don't like the facts please feel free to present you own facts. In fact, please do so. But please only use facts from reliable sources. Reliable sources would be the government agencies that collect and present this data. To sit at this table, you must bring data (properly adjusted for inflation) that is from sources used by all economists not from sources whose credibility is non-existent.
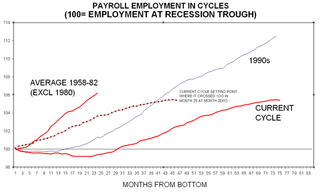
Let's start with the consumer side of the equation. First , job growth during this expansion is the weakest of any recovery since WWII. (This information comes from the National Bureau of Economic Research and the Bureau of Labor Statistics)
As a result, real median household income (income adjusted for inflation) is now lower than it was at the beginning of this expansion (this is the first time this has happened in 40 years)
...
So -- where did the money for consumer spending come from? Part of it came from savings. Here is a chart from the St. Louis Federal Reserve of U.S. national savings. Notice this number has been decreasing for the last 25 years and is currently hovering around 0%.
...
Debt is the real source of funds for this expansion (this information comes from the Federal Reserve's Flow of Funds report and the Bureau of Economic Analysis).
[Figure: Household debt jumped from 70% to 97% of GDP since 2000 ... double level of 1980]
[Figure: Household debt jumped from 95% of income to 133% since 2000 ... doubled since 1980]
As a result of this increased debt load, a larger portion of consumer's income (which has been stagnant for this expansion) is going to debt payments:
So looking at the consumer we see the following picture emerge.
1.) Job growth was the weakest of any post WWII recovery.
2.) Real median income actually dropped for the duration of this expansion.
3.) To sustain consumption, consumers went on a mammoth debt acquisition binge, so that now
4.) Debt payments are as high as they have ever been on a percentage of disposable income basis.
So after 7 years of economic expansion we have lower incomes and more debt.
However, the consumer isn't the only person who ran up a ton of debt.
The Bush White House has again run up the national credit card. Here is a list of total debt outstanding at the end of the government's fiscal year:
09/30/2007 $9,007,653,372,262.48
09/30/2006 $8,506,973,899,215.23
09/30/2005 $7,932,709,661,723.50
09/30/2004 $7,379,052,696,330.32
09/30/2003 $6,783,231,062,743.62
09/30/2002 $6,228,235,965,597.16
09/30/2001 $5,807,463,412,200.06
09/30/2000 $5,674,178,209,886.86
The current debt outstanding is $9,437,425,175,221.31
....................
So let's sum up.
1.) The weakest job growth since WWII led to a declining median family income.
2.) In order to keep spending the U.S. consumer continued to save less and borrow more.
3.) At the national level, the U.S. government has issued over $500 billion dollars of net new debt per year since 2002. This has led to an increased reliance on foreign investors to finance our way of life.
4.) The trade deficit has continued to expand, although oil is responsible for a fair amount of that increase.
5.) In short, the U.S. continues to consume more than it produces.
At some point, we will have to pay the bill.
This is the end result of the "Bush boom" or "the greatest story never told."
No comments:
Post a Comment