On The Hill: In The 'Back Seat' No More: New Legislation Would Protect Workers, Retirees When Their Employers Go Bankrupt
...
“Workers of distressed companies are frequently asked to save their companies by sacrificing their wages, benefits and right to collective bargaining while executives are rewarded with bonuses and golden parachutes,” said Conyers. “Our bill establishes that sacrifice should be spread evenly among all employees when companies face bankruptcy.”
Lawmakers say that the Protecting Employees and Retirees in Business Bankruptcies Act would protect workers from losing out by:
Improving Recoveries for Employees and Retirees:
· Doubles the maximum value of wage claims entitled to priority payment for each worker to $20,000
· Allows a second claim of up to $20,000 for contributions to employee benefit plans
· Eliminates the restriction that wage and benefit claims must be earned within 180 days of the bankruptcy filing in order to be entitled to priority payment
· Allows workers to assert claims for losses in certain defined contribution plans when such losses result from employer fraud or breach of fiduciary duty
· Establishes a new priority administrative expense for workers’ severance pay
· Clarifies that back pay awarded via WARN Act damages are entitled to the same priority as back pay for other legal violations
Reducing Employees’ and Retirees’ Losses:
· Restricts the situations in which collective bargaining agreements can be rejected, tightens the criteria by which collective bargaining agreements can be amended, and encourages negotiated settlements
· Toughens the procedures through which retiree benefits can be reduced or eliminated, including preventing companies seeking retiree health benefit reductions from singling out non-management retirees for concessions
· Requires the court to consider the impact of a bidder’s offer to purchase a company’s assets would have on maintaining existing jobs and preserving retiree pension and health benefits
· Clarifies that the principal purpose of Chapter 11 bankruptcy is the preservation of jobs to the maximum extent possible
Restricting Executive Compensation Programs:
· Requires disclosure and court approval of executive compensation for firms in bankruptcy
· Prohibits the payment of bonuses and other forms of incentive compensation to senior officers and others
· Ensures that insiders cannot receive retiree benefits if workers have lost their retirement or health benefits
Durbin and Conyers say that their bill enjoys strong labor support.
“Workers and retirees throughout American industry have seen hard-won benefits stripped away by a deadly combination of American bankruptcy laws and other governmental policies that have for years been aligned against their interests,” ....
Thursday, February 25, 2010
OpEdNews - Article: The Least Productive People in the World
OpEdNews - Article: The Least Productive People in the World

Income and Productivity Charts
Income and Productivity Charts
Productivity, as determined by labor output, has been measured for decades, or longer.But, while it's important to look at who, or what, is the most productive person or enterprise, shouldn't we also look at the least productive people, that is, the least effective laborers? Perhaps by understanding who the least productive people are, we can learn how to make them more productive. This would help them, and help society.
So, who are the least productive people?
...
Pandit didn't create the mess Citi is in, but"when Pandit took over, Citi was already on track to report write-downs and increased credit costs of $20 billion. Today, the banking supermarket is propped up by $45 billion in bailouts and is, in effect, owned by the U.S. government.
THE STAT: Although Pandit's currently earning $1 a year, his pay package was valued at $38.2 million for 2008, a year when taxpayers kept the firm in business.
Carly Fiorina Hewlett-Packard
A consummate self-promoter, Fiorina was busy pontificating on the lecture circuit and posing for magazine covers while her company floundered. She paid herself handsome bonuses and perks while laying off thousands of employees to cut costs. The merger Fiorina orchestrated with Compaq in 2002 was widely seen as a failure. She was ousted in 2005.
THE STAT: HP stock lost half its value during Fiorina's tenure.
Stanley O'Neal Merrill Lynch
Stanley O'Neal's abrasive personality and ruthless cost cutting earned him many enemies, but his push toward riskier bets and subprime exposure led to his ouster. After Merrill posted the biggest quarterly loss in its 93-year history--and O'Neal was caught approaching Wachovia about a merger without the board's approval--he was finally fired.
THE STAT: O'Neal walked out the door with $161.5 million in severance.
Gerald Levin Time-Warner
Levin's failure comes down to one colossal mistake: In his desperate eagerness to become a new-media CEO, he orchestrated a megamerger between Time Warner and a vastly overvalued AOL--one of the worst acquisition deals ever. "He had the largest midlife crisis in the history of American capitalism," one of our panelists quipped.
THE STAT: The AOL deal destroyed over $200 billion in Time Warner shareholder value.
...
Roger Smith General Motors
The CEO's job is often thankless, and no one was ever thanked less than Roger Smith, General Motors chairman from 1981 to 1990 and the unwitting stooge of Michael Moore's mockumentary Roger and Me.
He started his career at the company in 1949 as a green-eyeshade guy, a lowly accounting clerk. His 1984 reorganization attempted to streamline GM's back-of-the-house operations but was, in a word, a disaster. It sowed confusion and disorder that practically idled the automaker for months. Current CEO Rick Wagoner has said, "We've been 12 to 14 years digging out from that."
Al Dunlap Scott Paper/Sunbeam Corporation
Picked by the board of Scott Paper Co. as the man to turn the struggling company around, Dunlap earned his nickname "Chainsaw Al" by slicing 11,000 employees. When Scott merged with Kimberly-Clark, Dunlap's payoff was estimated at more than $100 million.
Dunlap's memoir/manifesto, Mean Business, roughly coincided with his next CEO star turn, which was also to be his last. Sunbeam's stock surged on the news that the Chainsaw was coming; massive workforce reductions and factory closures followed within months.
Unable to flip Sunbeam to a new buyer, as he'd done with Scott, Dunlap was stuck actually running the company. He failed spectacularly. Within two miserable years, the board fired him. The tactics he'd used to stave off losses--the company overstated its net income by $60 million, which was real money back (in 1998)--earned him a civil suit from the SEC and a class-action suit by shareholders. Dunlap eventually settled both and was barred from serving as an officer or director of any public company.
Bernie Ebbers - Worldcom
The ultimate corporate shopaholic, Ebbers bought an obscure telephone carrier in the 1980s and went on a 17-year acquisition binge that turned it into the world's largest telecom company. Alas, his passion for dealmaking didn't translate into the savvy necessary for running the complex business. When telecom stocks went south in 2000, the company's massive debt was exposed. Ebbers tried to disguise it through fraudulent accounting. In 2005, three years after WorldCom filed for bankruptcy, he was convicted of overseeing $11 billion worth of accounting fraud. He's now serving a 25-year prison term.
THE STAT: When Ebbers resigned, in 2002, WorldCom stock had fallen to $1.79 from a peak of $64.50 in 1999.
Ken Lay - Enron
...
OpEdNews - Article: Smaller federal government equals bigger corporate government
OpEdNews - Article: Smaller federal government equals bigger corporate government
...
America's workers became a vibrant middle-class, not only by providing society with necessary services, but also because the federal government protected their living standards against the power of financial interests to control the labor market.
For much of the past century our national political leaders passed laws that minimized the destructive competition that could occur between states as they lowered their labor standards in order to attract industry. They could go only so far in the race to the bottom when it came to hourly wages, safe working conditions, the 40-hour workweek, child labor, and so on. As a result, the U.S.--as a unified nation--developed the strongest and most vibrant middle class in history.
However, conservative politicians gradually reversed the process that made the U.S. the most powerful and economically successful country in the world. Instead of preventing destructive competition between states, they encouraged it. When the federal government allowed states to enact "right-to-work" laws, anti-union states attracted industry by offering corporations a relatively union-free environment, compared to states that still respected workers' right to organize. Anti-labor states also increased their competitiveness by barely meeting federal standards for wages and working conditions, thus undercutting states that had higher than federal standards.
The trend continues today, as corporations pit states against each other in bidding for new industry. The state that can give a corporation the biggest tax breaks and can assure a union-free environment, the fewest worker protections, and the greatest government handouts (such as road and rail construction, free fire and police protections, lower utility costs)--is the state that gets to reduce its ruinous unemployment rate.
This same principle works on a global level, and is the reason globalization (trade based on corporations' freedom to locate in those countries with the lowest wages and fewest worker protections) will be a disaster for our country if not reversed. There is no central world government to limit the extent to which desperate countries can compete for industry by offering the best tax breaks, free government services and a defenseless workforce.
Weakening the federal government and encouraging outsourcing to foreign countries are deliberate political strategies for ensuring a roaring U.S. stock market and rapid increases in investor wealth--and chronic, low-wage employment for everyone who actually has to work for a living.
To gain support for corporations' power to pit states against each other, some politicians are trying to prove that a strong federal government is bad and should be emasculated. A way to do that is to make sure it can't successfully address the growing problems everyone is complaining about: chronic unemployment, a broken healthcare system, declining infrastructure, and stagnant wages. And they're succeeding simply by saying "no."
Sure, a central government can be overreaching and can make terrible decisions, but the solution for a bad federal government isn't less federal government, it's good federal government.
OpEdNews - Article: Real, Uglier American Unemployment
OpEdNews - Article: Real, Uglier American Unemployment
Can you trust national averages? As bad as the jobless data you hear are, you have not been told the whole truth. If you think the terrible impact of America's Great Recession is shown by an official unemployment rate of about 10 percent, think again.
Economic inequality and the myth of Reagan trickle down logic are shown by new data from the Center for Labor Market Studies at NortheasternUniversity in Boston. The report noted: "What has been missing from the public debate over the labor market crisis is an honest and detailed analysis of which American workers have been most adversely affected by the deep deterioration in labor markets." The researchers found a correlation between household income and unemployment rate in the last quarter of 2009: Look carefully at these numbers and see how unemployment rises as income drops:
$150,000 or more, 3.2 percent
$100,000 to 149,999, 8 percent
$75,000 to $99,999, 5 percent
$60,000 to $75,000, 6.4 percent
$50,000 to $59,000, 7.8 percent
$40,000 to $49,000, 9 percent
$30,000 to $39,999, 12.2 percent
$20,000 to $29,999, 19.7 percent
$12,500 to $20,000, 19.1 percent
$12,499 or less, 30.8 percent
Ten times worse unemployment in the lowest class than in the highest class! ...
The report summed up the situation: "A true labor market depression faced those in the bottom"of the income distribution; a deep labor market recession prevailed among those in the middle of the distribution, and close to a full employment environment prevailed at the top." People at the top remain winners no matter how bad the whole economy. Why?The wealthy Upper Class controls so much of the political system and benefit from countless government policies. They may lose something in an economic meltdown but not enough to suffer significantly.
Conversely, those at the bottom of the economic system with no political power are experiencing something as bad as the Great Depression, with no end in sight.
...
Wait; there is even more bad news. When underemployment is factored in -- part time workers that want to work full time, and those who have stopped looking but want a job -- the picture gets even worse. In the lowest group, the underemployment rate was 20.6 percent, compared with just 1.6 percent in the highest group. So the total in the lowest class is 51.4 percent (3.7 million people) compared to 4.8 percent in the wealthy class (530,000 people). Also consider that last November nearly 20 percent of all men between 25 and 54 did not have jobs, the highest figure since the labor bureau began counting in 1948.
Now you know why the constantly noted official jobless rate for the nation of 10 percent and 17 percent when underemployment is counted are a joke, or is it a purposeful deception, like a truth bubble? ....
Monday, February 22, 2010
US super-rich get five times more income than in 1995
US super-rich get five times more income than in 1995 By Andre Damon | 20 February 2010 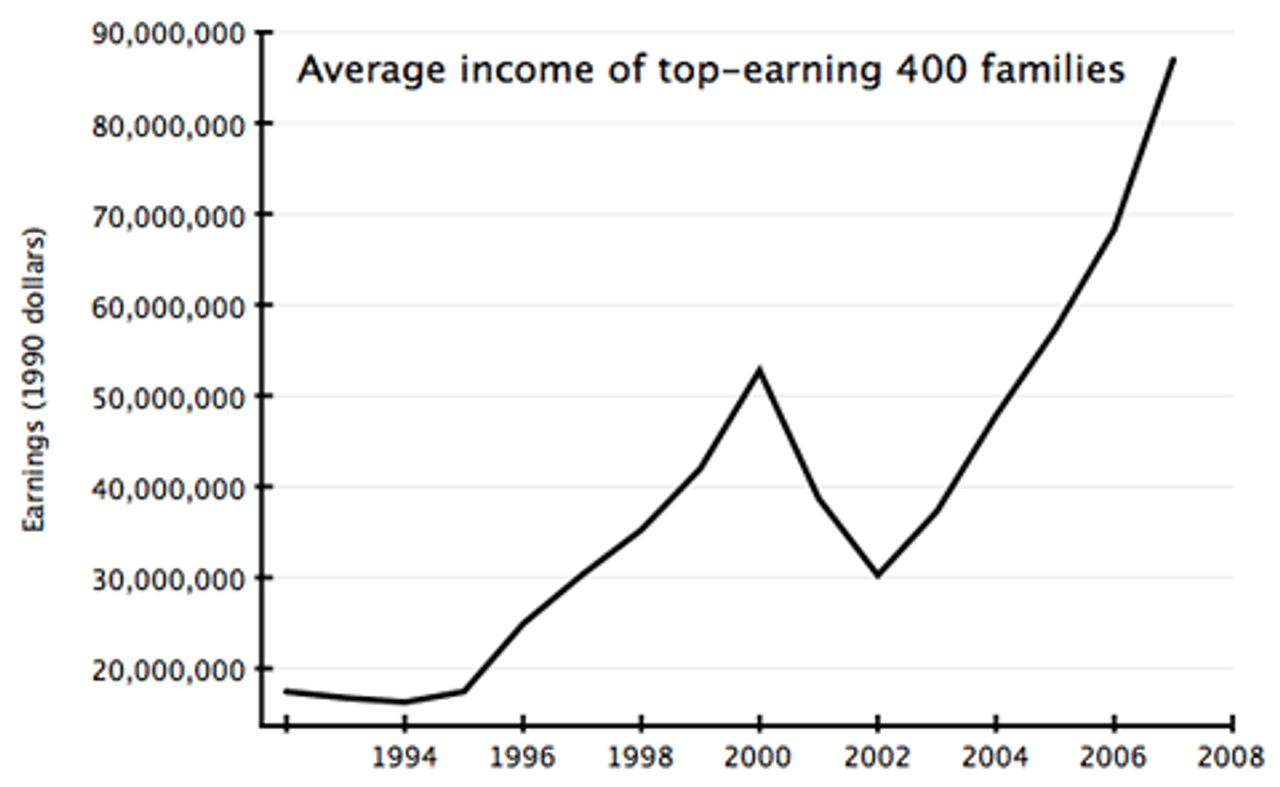
The incomes of the very rich in the US grew phenomenally between 1992 and 2007, while their tax rates plummeted, according to recently uncovered IRS statistics.
The figures were published on the IRS web site in December of 2009, but received little notice because they were not announced. The report only became widely known when Tax Analysts, a news outlet for tax information, discovered the document and wrote about it on its web site, tax.com, on Thursday.
The report shows that the average income for the top-earning 400 families, denominated in 1990 dollars, grew from $17 million to $87 million, representing a five-fold increase in real terms. During this time, the percentage of the total national income that went to the top 400 families tripled, from .52 percent in 1992 to 1.59 in 2007.
The data shows that these families saw their incomes increase by 31 percent between 2006 and 2007 alone, while the average income of each family reached $345 million. ...
Top 1%: Lower Tax Rate Than Their Secretaries | OurFuture.org
Top 1%: Lower Tax Rate Than Their Secretaries | OurFuture.org
Yes, there is a class war, Warren Buffett once said, and my class is winning. The IRS study of taxes paid in 2007 makes his point. The top 1% of taxpayers averaged about $138 million in income, and paid taxes at a rate of 16.6%.
As Buffett says, their secretaries pay a higher rate. No wonder Republicans and conservaDems like the much regretted Evan Bayh are fighting to lower the estate tax rate as part of a "jobs" bill. These folks will have a lot to put in the estate that's never been taxed as income.
Ah, for the extremist liberal days of Ronald Reagan when capital gains were taxed at the same rate as income.
For a report on the IRS study, here's the WSJ David Wessel on the IRS Study
The top 400 U.S. individual taxpayers got 1.59% of the nation’s household income in 2007, according to their tax returns, three times the slice they got in the 1990s, according to the Internal Revenue Service. They paid 2.05% of all individual income taxes in that year.
In its annual update of the taxes paid by the 400 best-off taxpayers, who aren’t identified, the IRS also said that only 220 of the top 400 were in the top marginal tax bracket. The 400 best-off taxpayers paid an average tax rate of 16.6%, lower than in any year since the IRS began making the reports in 1992.
...
About 81.3% of the income of the top 400 households came in the form of capital gains, dividends or interest, the IRS data show. Only 6.5% came in the form of salaries and wages. ...
Saturday, February 20, 2010
Super-Rich Got 31% Richer in 2007 | Drudge Retort
The 400 highest-earning U.S. households reported an average of $345 million in income in 2007, up 31 percent from a year earlier, IRS statistics show. "Income at the very top has exploded and their taxes have been cut dramatically," said Chuck Marr, director of federal tax policy at the Center on Budget and Policy.
Thursday, February 18, 2010
Arianna Huffington: Band-Aids, Bipartisanship and Baby-Steps: How Not to Deal With a Jobs Crisis
Arianna Huffington: Band-Aids, Bipartisanship and Baby-Steps: How Not to Deal With a Jobs Crisis
...
...
Less than a month ago, during his State of the Union speech, President Obama declared, "jobs must be our No. 1 focus in 2010." So why is there no sense of urgency coming out of Washington?
Perhaps the reason can be found in the stunning results of a study conducted by Northeastern University's Center for Labor Studies that broke down the unemployment rate by income. Unemployment for those making $150,000 a year, the study found, was only 3 percent in the last quarter of 2009. The rate for those in the middle income range was 9 percent -- not far off the national average. The rate for those in the bottom 10 percent of income was a staggering 31 percent.
These numbers, according to the Wall Street Journal's Robert Frank, "raise questions about the theory behind what is informally known as 'trickle down' economics, since full employment at the top doesn't seem to be translating into more jobs below.'"
In fact, these numbers do more than raise questions -- they also supply the answers.
Does anyone believe that the sense of urgency coming out of Washington wouldn't be wildly different if it was the unemployment rate in the top ten percent that was 31 percent? If one-third of television news producers, pundits, bankers, and lobbyists were unemployed, would the measures being proposed by the White House and Congress still be this pathetic? Of course not -- the sense of national emergency would be so great you'd practically be hearing air raid sirens howling.
Instead we get baby steps, bipartisanship, and band-aids -- timid moves that, given the seriousness of the crisis, threaten to change the very fabric of our society. For much of our history, America was known for its upward mobility -- and the promise that hard work would be rewarded with your children being able to do better than you. That promise has been called into question over the last three decades, and an extended run of high unemployment could be its death knell.
"These are the kinds of jobless rates that push families already struggling on meager incomes into destitution," wrote Bob Herbert. "And such gruesome gaps in the condition of groups at the top and bottom of the economic ladder are unmistakable signs of impending societal instability. This is dangerous stuff."
So dangerous, in fact, that when it comes to jobs we can't afford a repeat of the health care reform fiasco, in which the president decided to sit out the debate, emerging only to give vague statements of encouragement and cryptic pronouncements about what he actually favored (does anyone, even at this late date, have a clue what that was, by the way?).
Wednesday, February 17, 2010
Robert Reich (The Bad Job Numbers and the Secret Second Stimulus)
Robert Reich (The Bad Job Numbers and the Secret Second Stimulus)
...
These statistics mask an even more troubling reality. Since the start of the recession in December 2007, around 8 million jobs have been lost. But this doesn’t include all the people who, in a growing national population, would have entered the labor market had there been jobs for them. These “never entereds” amount to an estimated 2.5 million. So, in truth, the national economy is down by 10.6 million jobs overall. There’s no way to make this up for years. The most painful political truth for Democrats is the nation won’t possibly be out of this jobs hole by the presidential election of 2012, even if the recovery is vigorous. Do the math. In order to get out of the hole, we’d need an average monthly increase of 400,000 jobs between now and then. But even at the peak of the 1990s jobs boom, the highest we ever got was 280,000 jobs a month. At the peak of the last recovery, in 2005, we got no higher than 212,000 jobs a month. Bottom line: Obama will be going into an election year with a higher total level of unemployment than before the Great Recession. He will have to argue that, were it not for his policies, things would be even worse. Counter-factuals like this do not sit well on bumper stickers.
Almost 40 percent of the jobless have been without work for over six months. That’s a record. People who have been out of the labor force for more than six months have a particularly hard time getting back in. Many never do.
What worries me most about all this is the trend line. If we were coming out of a recession with any potential strength in the job market, we’d at least see growth in the length of the average workweek. But there’s no sign of any growth. The average workweek held steady in December at 33.2 hours. Employers aren’t even giving their own workers more hours.
Big American companies are more profitable, to be sure. But there’s a massive disconnect between profitability and employment. Companies are increasing profits by cutting their costs (including payrolls), outsourcing more jobs abroad, and selling more abroad. But American workers — and, therefore, American consumers — are still stuck in a deep recession. ....
Tuesday, February 16, 2010
Suburban Homeless: Rising Tide Of Women, Families
Suburban Homeless: Rising Tide Of Women, Families
ROOSEVELT, N.Y. — Homelessness in rural and suburban America is straining shelters this winter as the economy founders and joblessness hovers near double digits – a "perfect storm of foreclosures, unemployment and a shortage of affordable housing," in one official's eyes.
"We are seeing many families that never before sought government help," said Greg Blass, commissioner of Social Services in Suffolk County on eastern Long Island.
"We see a spiral in food stamps, heating assistance applications; Medicaid is skyrocketing," Blass added. "It is truly reaching a stage of being alarming."
The federal government is again counting the nation's homeless and, by many accounts, the suburban numbers continue to rise, especially for families, women, children, Latinos and men seeking help for the first time. Some have to be turned away.
"Yes, there has definitely been an increased number of turnaways this year," said Jennifer Hill, executive director of the Alliance to End Homelessness in suburban Cook County, Illinois. "We're seeing increases in shelter use along the lines of 30 percent or more."
The U.S. Department of Housing and Urban Development's annual survey last year found homelessness remained steady at about 1.6 million people, but the percentage of rural or suburban homelessness rose from 23 percent to 32 percent. The 2009 HUD report, which reflected the 12 months ending Sept. 30, 2008, also found the number of sheltered homeless families grew from about 473,000 to 517,000. ...
OpEdNews - Article: A Country of Serfs Ruled By Oligarchs
OpEdNews - Article: A Country of Serfs Ruled By Oligarchs | By Paul Craig Roberts (about the author)
The media has headlined good economic news: fourth quarter GDP growth of 5.7 percent ("the recession is over"), January retail sales up, productivity up in 4th quarter, the dollar is gaining strength. Is any of it true? What does it mean?
The media has headlined good economic news: fourth quarter GDP growth of 5.7 percent ("the recession is over"), January retail sales up, productivity up in 4th quarter, the dollar is gaining strength. Is any of it true? What does it mean?
The 5.7 percent growth figure is a guesstimate made in advance of the release of the U.S. trade deficit statistic. It assumed that the U.S. trade deficit would show an improvement. When the trade deficit was released a few days later, it showed a deterioration, knocking the 5.7 percent growth figure down to 4.6 percent. Much of the remaining GDP growth consists of inventory accumulation.
More than a fourth of the reported gain in January retail sales is due to higher gasoline and food prices. Questionable seasonal adjustments account for the rest. Productivity was up, because labor costs fell 4.4 percent in the fourth quarter -- the fourth successive decline.Initial claims for jobless benefits rose. Productivity increases that do not translate into wage gains cannot drive the consumer economy. Housing is still under pressure, and commercial real estate is about to become a big problem.
...Without growth in consumer incomes, the economy can go nowhere. Washington policymakers substituted debt growth for income growth. Instead of growing richer, consumers grew more indebted. Federal Reserve chairman Alan Greenspan accomplished this with his low interest rate policy, which drove up housing prices, producing home equity that consumers could tap and spend by refinancing their homes. Unable to maintain their accustomed living standards with income alone, Americans spent their equity in their homes and ran up credit card debts, maxing out credit cards in anticipation that rising asset prices would cover the debts. When the bubble burst, the debts strangled consumer demand, and the economy died. ...
Monday, February 15, 2010
The Economic Elite Have Engineered an Extraordinary Coup, Threatening the Very Existence of the Middle Class | Economy | AlterNet
The Economic Elite Have Engineered an Extraordinary Coup, Threatening the Very Existence of the Middle Class | Economy | AlterNet
It has now become evident to a critical mass that the Republican and Democratic parties, along with all three branches of our government, have been bought off by a well-organized Economic Elite who are tactically destroying our way of life. The harsh truth is that 99 percent of the U.S. population no longer has political representation. The U.S. economy, government and tax system is now blatantly rigged against us.
Current statistical societal indicators clearly demonstrate that a strategic attack has been launched and an analysis of current governmental policies prove that conditions for 99 percent of Americans will continue to deteriorate. The Economic Elite have engineered a financial coup and have brought war to our doorstep...and make no mistake, they have launched a war to eliminate the U.S. middle class.
...
America is the richest nation in history, yet we now have the highest poverty rate in the industrialized world with an unprecedented amount of Americans living in dire straights and over 50 million citizens already living in poverty.
The government has come up with clever ways to downplay all of these numbers, but we have over 50 million people who need to use food stamps to eat, and a stunning 50 percent of U.S. children will use food stamps to eat at some point in their childhoods. Approximately 20,000 people are added to this total every day. In 2009, one out of five U.S. households didn't have enough money to buy food. In households with children, this number rose to 24 percent, as the hunger rate among U.S. citizens has now reached an all-time high.
We also currently have over 50 million U.S. citizens without health care. 1.4 million Americans filed for bankruptcy in 2009, a 32 percent increase from 2008. As bankruptcies continue to skyrocket, medical bankruptcies are responsible for over 60 percent of them, and over 75 percent of the medical bankruptcies filed are from people who have health care insurance. We have the most expensive health care system in the world, we are forced to pay twice as much as other countries and the overall care we get in return ranks 37th in the world.
In total, Americans have lost $5 trillion from their pensions and savings since the economic crisis began and $13 trillion in the value of their homes. During the first full year of the crisis, workers between the age of 55 - 60, who have worked for 20 - 29 years, have lost an average of 25 percent off their 401k. "Personal debt has risen from 65 percent of income in 1980 to 125 percent today." Over five million U.S. families have already lost their homes, in total 13 million U.S. families are expected to lose their home by 2014, with 25 percent of current mortgages underwater. Deutsche Bank has an even grimmer prediction: "The percentage of 'underwater' loans may rise to 48 percent, or 25 million homes." Every day 10,000 U.S. homes enter foreclosure. Statistics show that an increasing number of these people are not finding shelter elsewhere, there are now over 3 million homeless Americans, the fastest-growing segment of the homeless population is single parents with children.
One place more and more Americans are finding a home is in prison. With a prison population of 2.3 million people, we now have more people incarcerated than any other nation in the world -- the per capita statistics are 700 per 100,000 citizens. In comparison, China has 110 per 100,000, France has 80 per 100,000, Saudi Arabia has 45 per 100,000. The prison industry is thriving and expecting major growth over the next few years. A recent report from the Hartford Advocate titled "Incarceration Nation" revealed that "a new prison opens every week somewhere in America."
Mass Unemployment
The government unemployment rate is deceptive on several levels. It doesn't count people who are "involuntary part-time workers," meaning workers who are working part-time but want to find full-time work. It also doesn't count "discouraged workers," meaning long-term unemployed people who have lost hope and don't consistently look for work. As time goes by, more and more people stop consistently looking for work and are discounted from the unemployment figure. For instance, in January, 1.1 million workers were eliminated from the unemployment total because they were "officially" labeled discouraged workers. So instead of the number rising, we will hear deceptive reports about unemployment leveling off.
On top of this, the Bureau of Labor Statistics recently discovered that 824,000 job losses were never accounted for due to a "modeling error" in their data. Even in their initial January data there appears to be a huge understating, with the newest report saying the economy lost 20,000 jobs. TrimTabs employment analysis, which has consistently provided more accurate data, "estimated that the U.S. economy shed 104,000 jobs in January."
When you factor in all these uncounted workers -- "involuntary part-time" and "discouraged workers" -- the unemployment rate rises from 9.7 percent to over 20 percent. In total, we now have over 30 million U.S. citizens who are unemployed or underemployed. The rarely cited "employment-participation" rate, which reveals the percentage of the population that is currently in the workforce, has now fallen to 64 percent.
...
"The American oligarchy spares no pains in promoting the belief that it does not exist, but the success of its disappearing act depends on equally strenuous efforts on the part of an American public anxious to believe in egalitarian fictions and unwilling to see what is hidden in plain sight." -- Michael Lind, To Have and to Have Not
It has now become evident to a critical mass that the Republican and Democratic parties, along with all three branches of our government, have been bought off by a well-organized Economic Elite who are tactically destroying our way of life. The harsh truth is that 99 percent of the U.S. population no longer has political representation. The U.S. economy, government and tax system is now blatantly rigged against us.
Current statistical societal indicators clearly demonstrate that a strategic attack has been launched and an analysis of current governmental policies prove that conditions for 99 percent of Americans will continue to deteriorate. The Economic Elite have engineered a financial coup and have brought war to our doorstep...and make no mistake, they have launched a war to eliminate the U.S. middle class.
...
America is the richest nation in history, yet we now have the highest poverty rate in the industrialized world with an unprecedented amount of Americans living in dire straights and over 50 million citizens already living in poverty.
The government has come up with clever ways to downplay all of these numbers, but we have over 50 million people who need to use food stamps to eat, and a stunning 50 percent of U.S. children will use food stamps to eat at some point in their childhoods. Approximately 20,000 people are added to this total every day. In 2009, one out of five U.S. households didn't have enough money to buy food. In households with children, this number rose to 24 percent, as the hunger rate among U.S. citizens has now reached an all-time high.
We also currently have over 50 million U.S. citizens without health care. 1.4 million Americans filed for bankruptcy in 2009, a 32 percent increase from 2008. As bankruptcies continue to skyrocket, medical bankruptcies are responsible for over 60 percent of them, and over 75 percent of the medical bankruptcies filed are from people who have health care insurance. We have the most expensive health care system in the world, we are forced to pay twice as much as other countries and the overall care we get in return ranks 37th in the world.
In total, Americans have lost $5 trillion from their pensions and savings since the economic crisis began and $13 trillion in the value of their homes. During the first full year of the crisis, workers between the age of 55 - 60, who have worked for 20 - 29 years, have lost an average of 25 percent off their 401k. "Personal debt has risen from 65 percent of income in 1980 to 125 percent today." Over five million U.S. families have already lost their homes, in total 13 million U.S. families are expected to lose their home by 2014, with 25 percent of current mortgages underwater. Deutsche Bank has an even grimmer prediction: "The percentage of 'underwater' loans may rise to 48 percent, or 25 million homes." Every day 10,000 U.S. homes enter foreclosure. Statistics show that an increasing number of these people are not finding shelter elsewhere, there are now over 3 million homeless Americans, the fastest-growing segment of the homeless population is single parents with children.
One place more and more Americans are finding a home is in prison. With a prison population of 2.3 million people, we now have more people incarcerated than any other nation in the world -- the per capita statistics are 700 per 100,000 citizens. In comparison, China has 110 per 100,000, France has 80 per 100,000, Saudi Arabia has 45 per 100,000. The prison industry is thriving and expecting major growth over the next few years. A recent report from the Hartford Advocate titled "Incarceration Nation" revealed that "a new prison opens every week somewhere in America."
Mass Unemployment
The government unemployment rate is deceptive on several levels. It doesn't count people who are "involuntary part-time workers," meaning workers who are working part-time but want to find full-time work. It also doesn't count "discouraged workers," meaning long-term unemployed people who have lost hope and don't consistently look for work. As time goes by, more and more people stop consistently looking for work and are discounted from the unemployment figure. For instance, in January, 1.1 million workers were eliminated from the unemployment total because they were "officially" labeled discouraged workers. So instead of the number rising, we will hear deceptive reports about unemployment leveling off.
On top of this, the Bureau of Labor Statistics recently discovered that 824,000 job losses were never accounted for due to a "modeling error" in their data. Even in their initial January data there appears to be a huge understating, with the newest report saying the economy lost 20,000 jobs. TrimTabs employment analysis, which has consistently provided more accurate data, "estimated that the U.S. economy shed 104,000 jobs in January."
When you factor in all these uncounted workers -- "involuntary part-time" and "discouraged workers" -- the unemployment rate rises from 9.7 percent to over 20 percent. In total, we now have over 30 million U.S. citizens who are unemployed or underemployed. The rarely cited "employment-participation" rate, which reveals the percentage of the population that is currently in the workforce, has now fallen to 64 percent.
...
Sunday, February 14, 2010
Stephen Fleischman: How the Corporations Broke America
Stephen Fleischman: How the Corporations Broke America
...
But corporate America was out to get organized labor from the year one. They found a champion in Ronald Reagan.
The successful campaign against labor was kicked off by President Ronald Reagan when he broke the Air Traffic Controllers strike in 1981.
As Labor Consultant Ray Abernathy recalls it, Reagan, “aided and abetted by former president Jimmy Carter and then-president of the AFL-CIO Lane Kirkland, fired 13,000 striking air traffic controllers, permanently replaced them, and drove the bar of U.S. labor relations so deep into the ground that we’ve never recovered.”
When the members of the Professional Air Traffic Controllers Organization, (PATCO) voted overwhelmingly to strike the government, Reagan reacted within 48 hours, fired the lot of them and ordered the FAA to hire permanent replacements.
Replacing strikers in this manner wasn’t against the law, but it had always been considered an extreme act and rarely done. When strikes were settled, a way was usually found to rehire striking workers with full seniority and often with back pay. But not in this case.
Former President Jimmy Carter already had it in for the Air Traffic Controllers during his administration when he planned the recruitment of replacement workers on rumors of a strike.
Lane Kirkland, certainly a union man, as head of the AFL-CIO, was miffed that the controllers had not consulted him before striking. He formally ordered AFL-CIO unions not to get involved in supporting their fellow unionists, the Air Traffic Controllers.
This sent a strong message to the corporate oligarchy. You can attack labor with impunity.
...
The next blow against labor was struck by President Bill Clinton with NAFTA and globalization. And he set the stage for George W. Bush and Barack Obama to continue the attack.
Dennis Kucinich called it right when he said, “‘Outsourcing’ is a process in which American jobs, mainly in technological fields, are contracted out to countries where wages are significantly lower. The typical salary for an American programmer is $70,000 a year. The typical salary for a programmer in India is $8,000 a year. U.S. companies are expected to ship 200,000 jobs a year to India in the near future, in pursuit of these lower wages, and we have already lost a significant fraction of our manufacturing jobs to countries overseas.”
The third prong of the attack was the military. Make a militarist nation out of the country. And that’s exactly what they’ve done. With a volunteer army and at least two wars going, they’ve jumped the defense (war) department to monster size.
President Barack Obama sent to Congress a proposed defense budget of $663.8 billion for fiscal 2010. The budget request for the Department of Defense (DoD) includes $533.8 billion in discretionary budget authority to fund base defense programs and $130 billion to support overseas contingency operations, primarily in Iraq and Afghanistan. ...
The Monopolization of America | CommonDreams.org
The Monopolization of America | CommonDreams.org
You walk into your local convenience store and head to the cold walk-in beer room in the back.
The choice is overwhelming.
Budweiser, Michelob, Bud Light, Busch Light, Stella Artois, Grolsch, Kirin,Tsingtao, Corona, Negra Modelo, Rolling Rock, Widmer, Miller and Coors.
In fact, all of these beers are controlled by two companies.
MillerCoors under the direction of South African Breweries (SAB) and AnheuserBusch In Bev.
Two multinational corporations controlling the beer choices of 300 million Americans.
And it's not just beer.
One single multinational corporation dominates the world supply of eyeglass stores.
One dominates the milk supply.
Barry Lynn goes down the list of industries.
And he finds a similar story across the board.
A handful of multinational corporations controlling each industry - or the supply chains of each industry.
Such dominant monopolies were illegal just thirty years ago.
But that all changed with Ronald Reagan and Robert Bork.
A corporatist oligarchy took hold.
President Obama has promised aggressive antitrust enforcement.
But Lynn says it's pie in the sky.
"It will take more than a lawsuit or two to overthrow America's corporatist oligarchy and restore a model of capitalism that protects our rights as property holders and citizens," Lynn argues in his new book - Cornered: The New Monopoly Capitalism and the Economics of Destruction (Wiley, 2010).
Antitrust law was developed to protect the political economy from extreme concentrations of corporate power.
Then came Reagan and Bork.
In 1978, Bork said we should have a consumer welfare test.
If economic concentration is good for the consumer - think Wal-Mart - then let it be.
Never mind the citizen.
In 1981, William Baxter, head of Reagan's Antitrust Division, announced that he would be guided by "an efficiency test."
"When Baxter first talked to the press in 1981, he said - we are going to impose an efficiency test," Lynn told Corporate Crime Reporter last week. "Those were the words he used. It was only a little bit later that they framed it as a consumer welfare test. And Robert Bork came up with that. Bork's book - The Antitrust Paradox - came out in 1978 and he floated this idea of a consumer welfare test."
"It took Baxter a couple of years to get the messaging together. They locked into the consumer welfare test. And it helped to bring along so many folks in the consumer movement. And for some reason, after focusing on safety, which is a fantastic thing that Ralph Nader did, they began fixating on prices. And there is a whole political analysis as to why they began fixating on prices. What groups were they targeting with that fixation?"
"In 1981, that marked a revolutionary change in how we applied our anti-monopoly laws. No longer was the primary consideration political. The primary consideration was prices and consumer welfare."
Lynn says that Bork didn't understand why the consumer movement didn't come after him on the consumer welfare test.
"In 1993, Bork put out a second edition of the Antitrust Paradox," Lynn said. "And in the introduction, he says - I don't understand what happened here. I thought the socialists were doing to come out and fight us tooth and nail on this. And they never did. We didn't think we were going to get this through. And we did." Mention the word "socialist" in this context, and Lynn sees red. ...
: Information Clearing House -� ICH
: Information Clearing House -� ICH
Deepening Debt Crisis:
The Bernanke Reappointment: Be Afraid, Very Afraid
By Prof Michael Hudson
...
Deepening Debt Crisis:
The Bernanke Reappointment: Be Afraid, Very Afraid
By Prof Michael Hudson
...
One popular (and thoroughly misleading) description of Bernanke that has been cited ad nauseum to promote his reappointment is that he is an expert on the causes of the Great Depression. If you are going to create a new crash, it certainly helps to understand the last one. But economic historians who have compared Mr. Bernanke’s writings to actual history have found that it is precisely his misunderstanding of the Depression that is leading him tragically to repeat it.
As a trickle-down apologist for high finance, Prof. Bernanke has drawn systematically wrong conclusions as to the causes of the Great Depression. The ideological prejudice behind his view is of course what got him his job in the first place, for as numerous observers have quipped, a precondition for being hired as Fed Chairman is that one does not understand how the financial system actually works. Instead of recognizing that deepening debt, low wages and the siphoning up of wealth to the top of the economic pyramid were primary causes of the Depression, Prof. Bernanke attributes the main problem simply to a lack of liquidity, causing low prices.
As my Australian colleague Steve Keen recently has written in his Debtwatch No. 42 (http://www.debtdeflation.com/blogs/), the case against Mr. Bernanke should focus on his neoclassical approach that misses the fact that money is debt. He sees the financial problem as being too low a price level for assets to be collateralized for bank loans. And to Mr. Bernanke, “wealth” is synonymous with what banks will lend, under existing credit terms.
In 1933, the economist Irving Fischer (mainly responsible for the “modern” monetarist tautology MV = PT) wrote a classic article, “The Debt-Deflation Theory of the Great Depression,” recanting the neoclassical view that had led him to lose his personal fortune in the 1929 stock market crash. He explained how the inability to pay debts was forcing bankruptcies, wiping out bank credit and spending power, shrinking markets and hence the incentive to invest and employ labor.
Mr. Bernanke rejects this idea, or at least the travesty he paraphrases in his Essays on the Great Depression (Princeton, 2000, p. 24), as Prof. Keen quotes:
Fisher’ s idea was less influential in academic circles, though, because of the counterargument that debt-deflation represented no more than a redistribution from one group (debtors) to another (creditors). Absent implausibly large differences in marginal spending propensities among the groups, it was suggested, pure redistributions should have no significant macroeconomic effects.
All that a debt overhead does is transfer purchasing power from debtors to creditors. Bernanke is reminiscent here of Thomas Robert Malthus, whose Principles of Political Economy argued that landlords (Malthus’s own class) were necessary to maintain economic equilibrium in a way akin to trickle-down theorists through the ages. Where would English employment be, Malthus argued, without landlords spending their revenue on coachmen, fine clothes, butlers and servants? It was landlords spending their rental income (protected by
The reality is that wealthy Wall Street financiers who make multi-million dollar salaries and bonuses spend their money on trophies: fine arts, luxury apartments or houses in gated communities, yachts, fancy handbags and high fashion, birthday parties with appearances by modish pop singers. (“I see the yachts of the stock brokers; but where are those of their clients?”) This is not the kind of spending that reflects the “real” economy’s production profile.
Mr. Bernanke sees no problem, unless rich people spend less of their gains on consumer goods and the products of labor than average wage earners. But of course this propensity to consume is precisely the point John Maynard Keynes made in his General Theory (1936). The wealthier people become, the lower a proportion of their income they consume – and the more they save.
This falling propensity to consume is what worried Keynes about the future. He imagined that as economies saved more as their income levels rose, they would spend less on goods and services. So output and employment would not be able to keep pace – unless the government stepped in to make up the gap.
Consumer spending is indeed falling, but not because economies are experiencing a higher net saving rate. The
The problem is that workers and consumers have gone deeper and deeper into debt, saving less and less. This is just the opposite of what Keynes forecast. Only the wealthiest 10 percent or so of the population save more and more – mainly in the form of loans to the “bottom 90 percent.” Saving less, however, goes hand in hand with consuming less, because of the revenue that the financial sector drains out of the “real” economy’s circular flow (wage-earners spending their income to buy the goods they produce) as debt service. The financial sector is wrapped around the production-and-consumption economy. So an inability to consume is part and parcel of the debt problem. The basis of monetary policy throughout the world today therefore should be how to save economies from shrinking as a result of their exponentially growing debt overhead.
Bernanke’s apologetics for finance capital: Economies seem to need more debt, not less
Bernanke finds “declines in aggregate demand” to be the dominant factor in the Great Depression (p. ix, as cited by Steve Keen). This is true in any economic downturn. In his reading, however, debt seems not to have anything to do with falling spending on what labor produces. Taking a banker’s-eye view, he finds the most serious problem to be the demand for stocks and real estate. Mr. Bernanke promises not to let falling asset demand (and hence, falling asset prices) happen again. His antidote is to flood the economy with credit as he is now doing, emulating Alan Greenspan’s Bubble policy.
The wealthiest 10 percent of the population do indeed save most of their money. They lend savings – and create new credit – to the bottom 90 percent, or gamble in derivatives or other zero-sum activities in which their gain (if indeed they make any) finds its counterpart in some other parties’ loss. The system is kept going not by government spending, Keynesian-style, but by new credit creation. That supports consumption, and indeed, lending against real estate, stocks and bonds enables borrowers to bid up their prices, enabling their owners to borrow yet more against these assets. The economy expands – until current revenue no longer covers the debt’s carrying charges.
That’s what brings the Bubble Economy down with a crash. Asset-price inflation gives way to crashing prices and negative equity for real estate and for much financial debt leveraging as well. It is in this sense that Prof. Bernanke’s blames the Depression on lower prices. When prices for real estate or other collateral plunge, it no longer can be pledged for more loans to keep the circular flow of lending and debt repayment in motion.
This circular financial flow is quite different from the circular flow that Keynes (and Say’s Law) discussed – the circulation where workers and their employers spent their wages and profits on consumer goods and investment goods. The financial circular flow is between the banks and their clients. And this circular flow swells as it diverts more and more spending from the “real” economy’s circular flow between income and spending. Finance capital expands relative to industrial capital.[1]
Higher prices in the “real” economy may help maintain the circular financial flow, by giving borrowers more current income to pay their mortgages, student loans and other debts. Mr. Bernanke accordingly sees FDR’s devaluation of the dollar as helping reflate prices. ...
...
This brings up the third premise that defenders of Mr. Bernanke cite: the much vaunted independence of the Federal Reserve. This is supposed to be safeguarding democracy. But the Fed should be subject to representative democracy, not independent of it! It rightly should be part of the Treasury representing the national interest rather than that of Wall Street.
This has emerged as a major problem within
Why on earth should the most important sector of modern economies – finance – be independent from the electoral process? This is as bad as making the judiciary “independent,” which turns out to be a euphemism for seriously right-wing. ...
...
For Bernanke, the current financial system (or more to the point, the debt overhead) is to be saved so that the redistribution of wealth upward will continue. The Congressional Research Service has calculated that from 1979 to 2003 the income from wealth (rent, dividends, interest and capital gains) for the top 1 percent of the population soared from 37.8% to 57.5%. This revenue has been expropriated from American employees pushed onto debt treadmills in the face of stagnating wages.
...
Behind these bad policies is a disturbing body of junk economics – one that, alas, is taught in most universities today. (Not at the
...
Financial debt service is not spent on consumer goods. It is recycled into new loans, after paying dividends to stockholders and salaries and bonuses to its managers. Stockholders spend their money on buying other investments – more stocks and bonds. Managers buy trophies – yachts, trophy paintings, trophy cars, trophy apartments (whose main value is their location – the neighborhood where their land is situated), foreign travel and other luxury. None of this spending has much effect on the consumer price index, but it does affect asset prices.
This idea is lacking in neoclassical and monetarist theory. Once “money” (that is, debt) is spent, it has an effect on prices via supply and demand, and that is that. There is no dynamic over time of debt or wealth. Ever since Marxism pushed classical political economy to its logical conclusion in the late 19th century, economic orthodoxy has been traumatized from dealing about wealth and debt. So balance-sheet relationships are missing from the academic economics curriculum. That is why I stopped teaching economics in 1972, until the UMKC developed an alternative curriculum to the
Saturday, February 13, 2010
Op-Ed Contributor - Microsoft’s Creative Destruction - NYTimes.com
Op-Ed Contributor - Microsoft’s Creative Destruction - NYTimes.com
AS they marvel at Apple’s new iPad tablet computer, the technorati seem to be focusing on where this leaves Amazon’s popular e-book business. But the much more important question is why Microsoft, America’s most famous and prosperous technology company, no longer brings us the future, whether it’s tablet computers like the iPad, e-books like Amazon’s Kindle, smartphones like the BlackBerry and iPhone, search engines like Google, digital music systems like iPod and iTunes or popular Web services like Facebook and Twitter.
Some people take joy in Microsoft’s struggles, as the popular view in recent years paints the company as an unrepentant intentional monopolist. Good riddance if it fails. But those of us who worked there know it differently. At worst, you can say it’s a highly repentant, largely accidental monopolist. It employs thousands of the smartest, most capable engineers in the world. More than any other firm, it made using computers both ubiquitous and affordable. Microsoft’s Windows operating system and Office applications suite still utterly rule their markets.
The company’s chief executive, Steve Ballmer, has continued to deliver huge profits. They totaled well over $100 billion in the past 10 years alone and help sustain the economies of Seattle, Washington State and the nation as a whole. ...
...
Microsoft has become a clumsy, uncompetitive innovator. Its products are lampooned, often unfairly but sometimes with good reason. Its image has never recovered from the antitrust prosecution of the 1990s. Its marketing has been inept for years; remember the 2008 ad in which Bill Gates was somehow persuaded to literally wiggle his behind at the camera?
While Apple continues to gain market share in many products, Microsoft has lost share in Web browsers, high-end laptops and smartphones. Despite billions in investment, its Xbox line is still at best an equal contender in the game console business. It first ignored and then stumbled in personal music players until that business was locked up by Apple.
Microsoft’s huge profits — $6.7 billion for the past quarter — come almost entirely from Windows and Office programs first developed decades ago. Like G.M. with its trucks and S.U.V.’s, Microsoft can’t count on these venerable products to sustain it forever. Perhaps worst of all, Microsoft is no longer considered the cool or cutting-edge place to work. There has been a steady exit of its best and brightest.
What happened? Unlike other companies, Microsoft never developed a true system for innovation. ....
Born Poor? | Santa Fe Reporter
Born Poor? | Santa Fe Reporter
32
The first number is the likelihood, expressed as a percentage, that a child born to parents whose incomes fall within the top 10 percent of Americans will grow up to be at least as wealthy.
The second is the percentage likelihood that a person born into the bottom 10 percent of society will stay at the bottom.
Just to drive the point home, here’s a third number: 1.3
That’s the percentage likelihood that a bottom 10 percenter will ever make it to the top 10 percent. For 99 out of 100 people, rags never lead to riches.
SANTA FE ECONOMIST SAMUEL BOWLES SAYS YOU BETTER GET USED TO IT | By: Corey Pein 02/03/2010
...
“The founders of the discipline of economics, almost to a man—and they were only men—thought that the problem of distribution between classes—they used the word classes—was the key to understanding why nations grew or not,” Bowles says.
What Bowles sees as the essence of his profession—problems of wealth distribution—the Friedmanites see as the road to hell.
In the years of easy credit, Friedmanites had the advantage. The recession has shifted the debate in favor of thinkers like Bowles.
“In the wake of what happened in the last year, it’s much easier for an economist to describe himself as being liberal, maybe even Social Democratic,” Henry Farrell, a political science associate professor at George Washington University, tells SFR. “Sam Bowles is still unashamedly and unabashedly a radical—God bless him.”
...
45.7
23
The first number is the “Gini coefficient” for New Mexico. The Gini is an expression economists use to measure equality or inequality in a society.
Zero describes the ultimate level playing field, a nonexistent land in which everyone has all the same stuff. A completely unequal society, in which one person has sole control of literally everything, would have a Gini of 100. New Mexico’s Gini score (45.7) reveals this state is more unequal than most. Utah is the most egalitarian state (with a 41.3 Gini), while the District of Columbia (53.7) is the most economically polarized, according to the most recent Census report, from 2006.
The second figure, 23, is the Gini for Sweden, the world’s most egalitarian country. Whereas most of Europe, Canada and Australia have Ginis in the low 30s, the US has over the past several decades developed inequalities usually found only in poor countries with autocratic governments.
So what? Isn’t inequality merely the price of America being No. 1?
“That’s almost certainly false,” Bowles tells SFR. “Prior to about 20 years ago, most economists thought that inequality just greased the wheels of progress. Overwhelmingly now, people who study it empirically think that it’s sand in the wheels.”
Bowles can take some credit for that shift, but he hasn’t won the battle. Many economists don’t study things empirically—that is, by looking at things in the real, physical world. Instead, they stay safely within the land of theory.
Theoryland may be the only place the “equality-efficiency trade-off” really works. Just to prove it wrong, Bowles charts the concept on a whiteboard at SFI.
...
Again with the numbers:
3032
The first number is the likelihood, expressed as a percentage, that a child born to parents whose incomes fall within the top 10 percent of Americans will grow up to be at least as wealthy.
The second is the percentage likelihood that a person born into the bottom 10 percent of society will stay at the bottom.
Just to drive the point home, here’s a third number: 1.3
That’s the percentage likelihood that a bottom 10 percenter will ever make it to the top 10 percent. For 99 out of 100 people, rags never lead to riches.
...
If Bowles is right, however, the answer is more handouts, not less.
More importantly: handouts for whom?
$21,200
$24,500
The first number is the annual unemployment benefit (before taxes) that can be claimed by an average New Mexico wage earner.
The second number is the minimum in state subsidies “green” manufacturing company C/D² Enterprises will receive for each employee it hires at its new plant in Mc
Kinley County. Most of the jobs will go to Navajo tribal members.
The first number represents a modest government grant to individuals on the condition that they keep looking for a wage-paying job.
The second represents a taxpayer-funded subsidy that virtually guarantees the owners of C/D² will make a profit.
The first number represents a modest government grant to individuals on the condition that they keep looking for a wage-paying job.
The second represents a taxpayer-funded subsidy that virtually guarantees the owners of C/D² will make a profit.
...
Three more numbers, none of them lucky:
42
38.8
46.4
The first is how many years have passed since Bowles was inspired by King to “put his heart and his head together” and study economic inequality.
The second is the Gini measure of inequality for the US back then, a level comparable to other wealthy nations like Japan or Israel today.
The third is the most recent US Gini, as calculated by the Census Bureau. It’s at a level comparable to the Philippines, a former colony of islands where every other person lives on less than $2 a day, or Rwanda, an even poorer country in Central Africa that was home to a genocide 16 years ago—a country whose name is often synonymous with hopelessness. SFR
...
The Rising Risks of Rising Economic Inequality: Do Americans Care?
The Rising Risks of Rising Economic Inequality: Do Americans Care?
...
Inequality is Rising, but Don’t Americans Still Think Inequality is a Good Thing?3
Before we consider Americans’ views of growing inequality, and all that it encompasses, we first have to understand their orientation toward inequality more generally. Here the distinction between inequality in principle and inequality in practice is a critical one. While Americans’ espouse principles of equality in the political realm (e.g., one man, one vote), they are less supportive of principles of complete equality in the economic realm. Indeed, economic inequality is viewed as fair because it rewards effort and talent, and it is viewed as necessary because it provides incentives for achievement and innovation, delivering greater prosperity to the entire society. As long as individual effort and talent are the only determinants of success, inequality in where people end up is considered just.4
...
Because it is possible that Americans would accept some degree of unfairness if they think it is necessary to maintain overall growth, economic conditions that seem unnecessary as well as unfair are the most likely to unsettle Americans’ faith in the American Dream.
This is precisely where the privatization of risk, and many other crucial elements of the overall rise in inequality, come into play. The increasing privatization of risk is a concrete example of inequity in practice. This matters because social scientists have long known that the term “inequality” itself is a very ill-defined and abstract one, especially when referring to income inequality, as opposed to racial or gender inequality, which at least involve differences between relatively clearly defined social groups (i.e., men and women, blacks and whites, etc.). As a result of the difficulty of mapping income onto real social groups, researchers do not use the term inequality in survey questions but instead ask about “differences in income” between “the rich and the poor” or “the haves and the have-nots,” and so on. While an improvement, even these are imprecise and open to a wide variety of interpretations.
In contrast, inequality-related issues that are either more accessible or more directly connected to the everyday experiences of individuals—failing pension and health plans for the middle class while executives enjoy premium coverage and stock market windfalls that can secure them in the event of a catastrophic illness, a temporary bout of unemployment, or old age—can better communicate the message of inequitable economic growth. But the issue must be linked to a framework of inequality, in which a few are gaining while the majority is losing out, in order for it to be deemed both unfair and unnecessary. Otherwise, if everyone is subject to the same cutbacks, then a little belt-tightening for everyone can be seen as a necessary and shared sacrifice on the road to greater prosperity. ...
...
agreement that inequality continues to exist because it benefits the rich ranges from a low of 49.4 percent in 1987 to a high of 63.4 in 1996, and agreement that large disparities in income are unnecessary for prosperity ranges from a low of 38.2 percent in 1987 to a high of 57.9 in 1996.
 ... |
Income inequality in the United States - Wikipedia, the free encyclopedia
Income inequality in the United States - Wikipedia, the free encyclopedia
...
The Gini coefficient measures income inequality on a scale from 0 to 1, based on the Lorenz Curve. On this scale 0 represents perfect equality with everyone having the exact same income and 1 represents perfect inequality with one person having all income (Scores are then commonly multiplied by 100 to make them easier to understand).[41] According to the United Nations (UN), gini index ratings for countries range from 24.7 in Denmark to 74.3 in Namibia. Mostpost-industrial nations had a gini coefficient in the high twenties to mid thirties. The UN places the US Gini index rating at 40.[42] Since the Census Bureau started measuring the Gini coefficient in 1967, it has risen by 20% for full-time workers and 18% for households. Among households, the index has risen from 39.7 to 46.9,[43] from 31.4 to 42.4 among men and from 29.8 to 35.7 among women.[44] According to Gini coefficient data, income inequality in the U.S., already among the highest in the post-industrial world,[16] has risen considerably between 1967 and 2005 among households[43] and individuals.[44]
..
Subscribe to:
Posts (Atom)